
Questions: How do we read an asphere measurement report?What do these terms mean? differential curve, measured profile, nominal profile, and slope deviation?
For a beginner, reading an asphere optics measurement report can indeed be confusing, because these terms describe the subtle difference between the theoretical design and the actual manufactured part. Here we use a simple analogy: think of an aspherical lens as a carefully designed roller coaster track.
Key Terms
1. Three core “Profiles”
- Nominal Profile: This is the perfect blueprint from the designer – the exact design height of every point on the roller coaster track. In the report, it is usually shown as a smooth reference line.
- Measured Profile: This is the actual shape of the manufactured track. Good manufacturing makes it as close as possible to the nominal profile.
- Differential Curve: In most reports, the differential curve refers to the Profile Deviation, i.e., Measured Profile minus Nominal Profile. It tells you, at each point on the lens surface, whether the actual surface is “higher” or “lower” than the design.
- Positive value: Actual surface is higher than design (excess material).
- Negative value: Actual surface is lower than design (missing material).
- The PV (peak-to-valley) and RMS (root mean square) values of this curve are key indicators of whether the lens is acceptable.
2. Slope Deviation
This is a more “sensitive” indicator than profile deviation. Back to the roller coaster analogy: profile deviation checks if the track height is correct; slope deviation checks whether the track’s slope changes smoothly.
- Optically, slope deviation directly affects the direction of light passing. Even if the height error at a point is only tens of nanometers, it will be like there is a tiny “bump” or “pit” (abrupt slope change) , light could be scattered, causing “ghost images.”
- In the report, slope deviation is the first derivative of profile deviation. It is often related to surface roughness. If this value exceeds tolerance, even if the surface looks smooth, the imaging might appear hazy or
How to quickly read a report (four steps)
1.Check the PV value
- First, confirm if PV is within the drawing tolerance (e.g., < 2 µm). Different applications have very different PV requirements (lighting can allow 5 µm, lithography requires <0.1 µm). If PV exceeds tolerance, reject the part directly – no need to look further.
2. Have a look at the slope deviation
- If Max Slope > 1 mrad (general precision) or > 0.3 mrad (high precision), scattered light may occur – evaluate whether this is acceptable.
3.Check decentration (UY and X0)
- Calculate UY in arcminutes, or consult the inspection report, and compare against the drawing’s centering tolerance.
4. See other auxiliary items
- Is A(PWR) abnormally large? Could cause defocus.
- Does the filter setting match the drawing requirements?
- Does the measured diameter meet the effective clear aperture (CA) requirement (e.g., 90% effective clear aperture)?
Note: In actual production, PV or RMS, and Centering error, off-centering, or Eccentricity, have been the most critical ones. Others, like slope deviation, act more often just as a reference indicator.
Example Illustration
Here below we use an real acylindrical lens report from our company’s German Mahr instrument (Profilometer) as an example to briefly illustrate how to examine if the product is qualified.
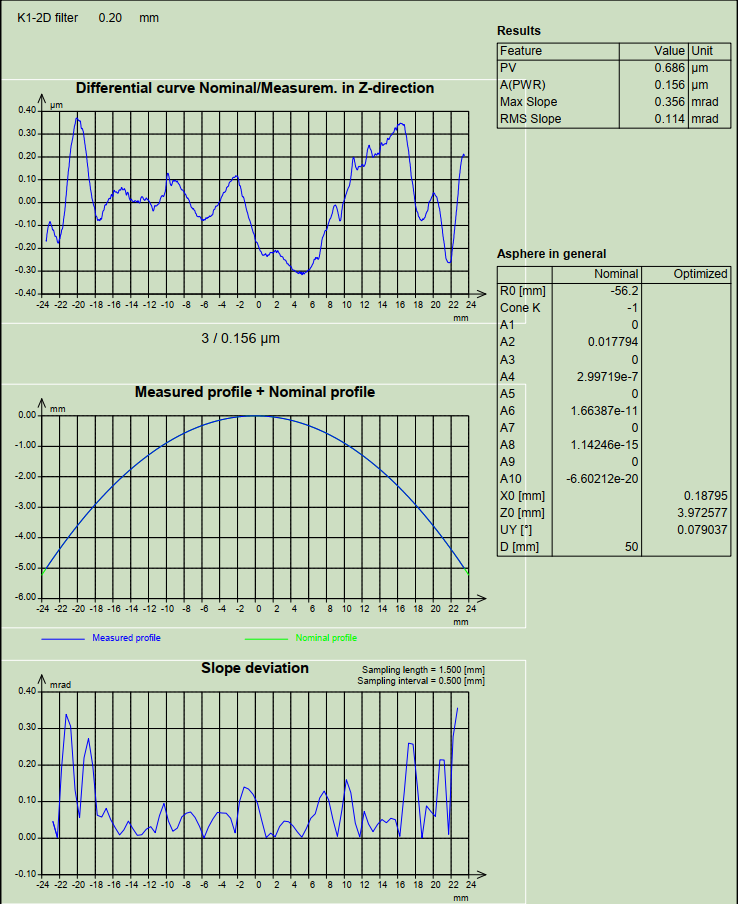
Overall structure of a Mahr aspheric measurement report
A complete Mahr aspheric lens report is usually divided into five sections:
- Measurement conditions and filters (top text)
- Differential curve (top left graph)
- Measured profile + Nominal profile (middle graph)
- Slope deviation (bottom left graph + table part)
- Results table (core numerical values)
- Asphere in general (bottom right table)
What conclusions can be drawn from this graph?
Differential Curve
- The overall fluctuation of the differential curve is very small: the curve swings roughly between -0.2 μm and +0.4 μm, indicating that the surface form deviation is well controlled.
- Symmetry: The deviation values on the left and right sides (‑25 mm and +25 mm) are approximately equal, with no obvious one side high and one side low asymmetry. This suggests that the measurement setup is basically centered (but off-centering should still be checked via UY or refer to inspection report).
- Note: Visual observation of the graph is only qualitative. Quantitative judgment must rely on the PV value in the results table.
Slope Deviation
Values from this report (see Results table):
| Parameter | Value | Unit | Evaluation |
| Max Slope | 0.356 | mrad | Very small, smooth surface |
| RMS Slope | 0.114 | mrad | Small statistical average, good overall consistency |
Conclusion: The slope deviation is excellent, and no significant scattering will occur.
Common Reminders
- Is a smaller PV always better?
For some special systems (e.g., those requiring a specific amount of spherical aberration), a certain PV value may be allowed. However, in general, the smaller the PV, the better. - The filter setting has a significant impact:
For the same lens, using a 0.25 mm filter vs. a 0.8 mm filter can yield PV values that differ by several times. Always measure with the filter setting specified on the drawing. - Other parameters.
such as material, dimensions/sizes, tolerances, surface quality, centering error, etc., please refer to Products Inspection Report of Photonchina. The report is usually provided together with the aspheric lens measurement report after production.
The asphere measurement report should generally be reviewed along with the product’s inspection report.